Analytics
The Dashboard provides comprehensive analytics for both chat and search. Monitor performance, identify trends, and discover content opportunities.
Chat Analytics
Navigate to your workspace and select the Chat tab.

Key Metrics
| Metric | Description |
|---|---|
| Total Conversations | All chat sessions in the period |
| Unique Visitors | Distinct visitors (via fingerprinting) |
| Unique Users | Authenticated/identified users |
| Avg Messages/Conversation | Conversation depth |
| Avg Tokens/Conversation | AI processing usage |
| Avg Duration | How long conversations last |
| Avg Response Time | AI response speed |
Time Filters
View metrics for different periods:
- Today
- Last 7 days
- Last 30 days
- Custom date range
Feedback Analytics
Track customer satisfaction:
| Metric | Description |
|---|---|
| Total Feedback | Number of ratings received |
| Positive | Thumbs up ratings |
| Negative | Thumbs down ratings |
| Feedback Rate | % of conversations with feedback |

Recent Negative Feedback
View conversations that received negative feedback to identify improvement areas:
- Conversation preview
- Feedback timestamp
- Link to full conversation
Conversation List
Browse all conversations:
| Column | Description |
|---|---|
| Date | When the conversation started |
| Messages | Number of messages exchanged |
| User | Visitor identifier (if available) |
| Preview | First message snippet |
Filters
- Date Range — Filter by time period
- Message Count — Minimum messages (e.g., 3+)
- Search — Find specific conversations
Viewing Conversations
Click a conversation to view the full thread:
- Complete message history
- Timestamps for each message
- User identification info
- Feedback given
- Token usage

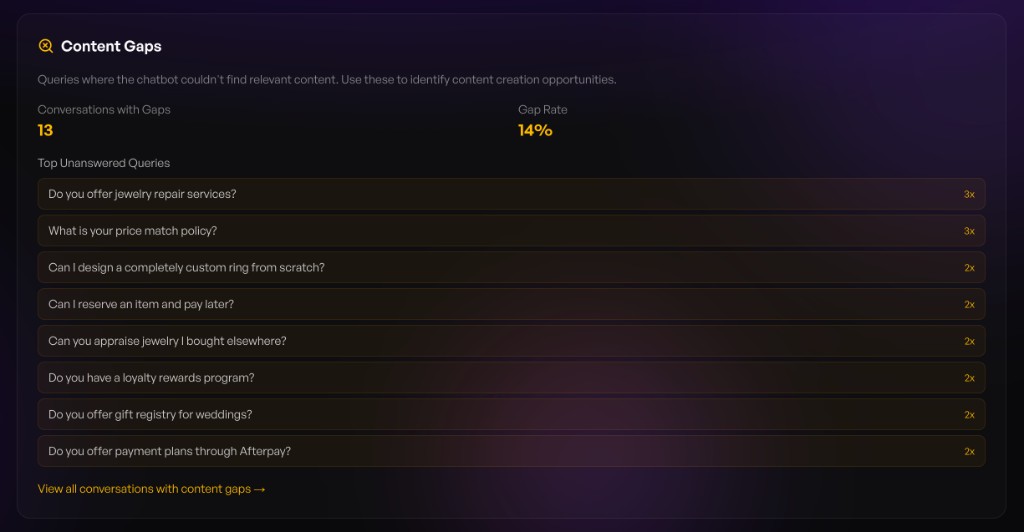
Content Gaps
Identify where your knowledge base is falling short. Content Gaps surfaces queries where the AI couldn't find relevant content to answer, helping you discover content creation opportunities.
| Metric | Description |
|---|---|
| Conversations with Gaps | Number of chats where the AI lacked relevant content |
| Gap Rate | Percentage of conversations affected |
| Top Unanswered Queries | Most common questions the AI couldn't answer, ranked by frequency |
Use this to prioritize what to add to your knowledge base:
- Add FAQ content for repeatedly asked questions
- Update product descriptions to cover common queries
- Create blog posts around topics visitors are asking about
- Add custom prompts to guide conversations for known gaps
Click View all conversations with content gaps to review the full threads and understand context behind each unanswered query.
Search Analytics
Navigate to your workspace and select the Search tab.

Key Metrics
| Metric | Description |
|---|---|
| Total Searches | All searches in the last 30 days |
| Unique Queries | Distinct search terms |
| Low Quality Searches | Searches with poor results |
| Zero Result Searches | Searches with no results |
Search Volume Chart
30-day area chart showing daily search activity. Identify:
- Peak usage times
- Trends over time
- Unusual spikes or drops
Top Searches
Most popular search queries:
| Column | Description |
|---|---|
| Query | The search term |
| Count | Number of times searched |
| Results | Whether results were found |
Use this to understand what customers are looking for.
Content Opportunities
Low-quality and zero-result searches reveal content gaps:
- Missing products — Items customers want but you don't have
- Missing content — Topics to cover in blog/FAQ
- Naming mismatches — Products customers search for differently
Search History
Detailed log of all searches:
| Column | Description |
|---|---|
| Query | Search term used |
| Source | Where the search originated (customer, chat, API) |
| Results | Number of results returned |
| Date | When the search occurred |
Filters
- Source — Customer, Chat, API, Other
- Zero Results Only — Show only failed searches
- Search — Find specific queries
Performance Insights
The home dashboard shows AI performance at a glance:
Customer Satisfaction
Overall satisfaction score based on:
- Feedback ratings
- Conversation completion
- Response relevance
Conversation Trends
Week-over-week changes:
- 📈 Green — Improvement
- 📉 Red — Decline
- ➡️ Gray — Stable
Activity Sparkline
14-day mini chart showing:
- Daily conversation volume
- Search activity
- Combined trends
Exporting Data
Currently, data can be viewed in the dashboard. For bulk exports or API access, contact support@intufind.com.
Next Steps
- Configure Chat Widget — Improve based on insights
- Manage Prompts — Add prompts for common queries
- Set Up Live Agent — Handle complex questions